Extra tabs
Besides the Observation tab are three other important tabs. In this section, we briefly review the important information you can get from them.
Station tab
The Station tab gives you an overview of the Site conditions: weather status, Sun and Moon position, etc… If something goes wrong (Sun is up in the sky, humidity is too high, wind blows too strong, etc…), the Station label at the top of the window gets colored, as well as the relevant part in the tab. The example below shows the Site status when the wind blows stronger than the defined pointing limit.
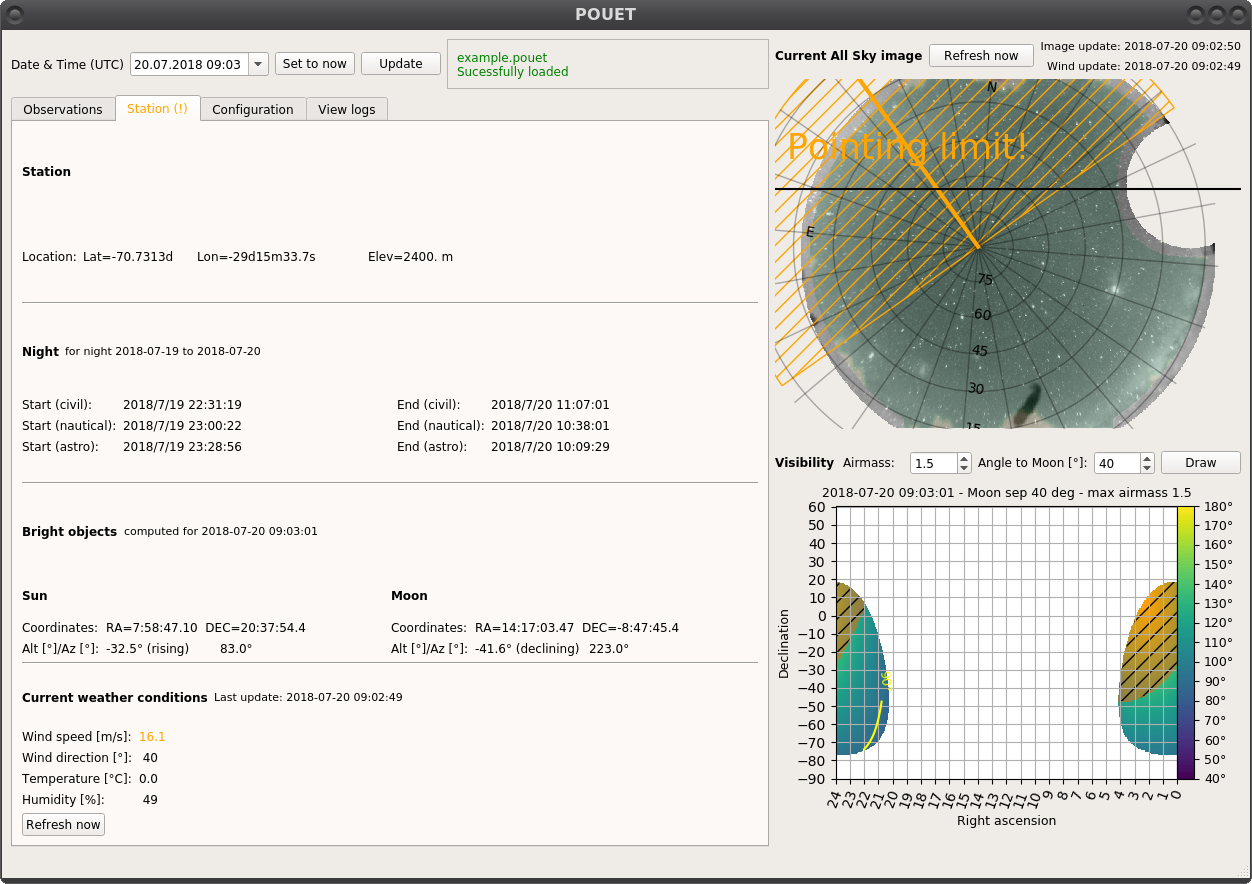
The Station tab of POUET indicates that the wind blows above the pointing limit.
The default values at which the Station panel gets colored can of course be redefined (see POUET configuration files).
Configuration tab
The Configuration tab allows you to change some of the running parameters of POUET.
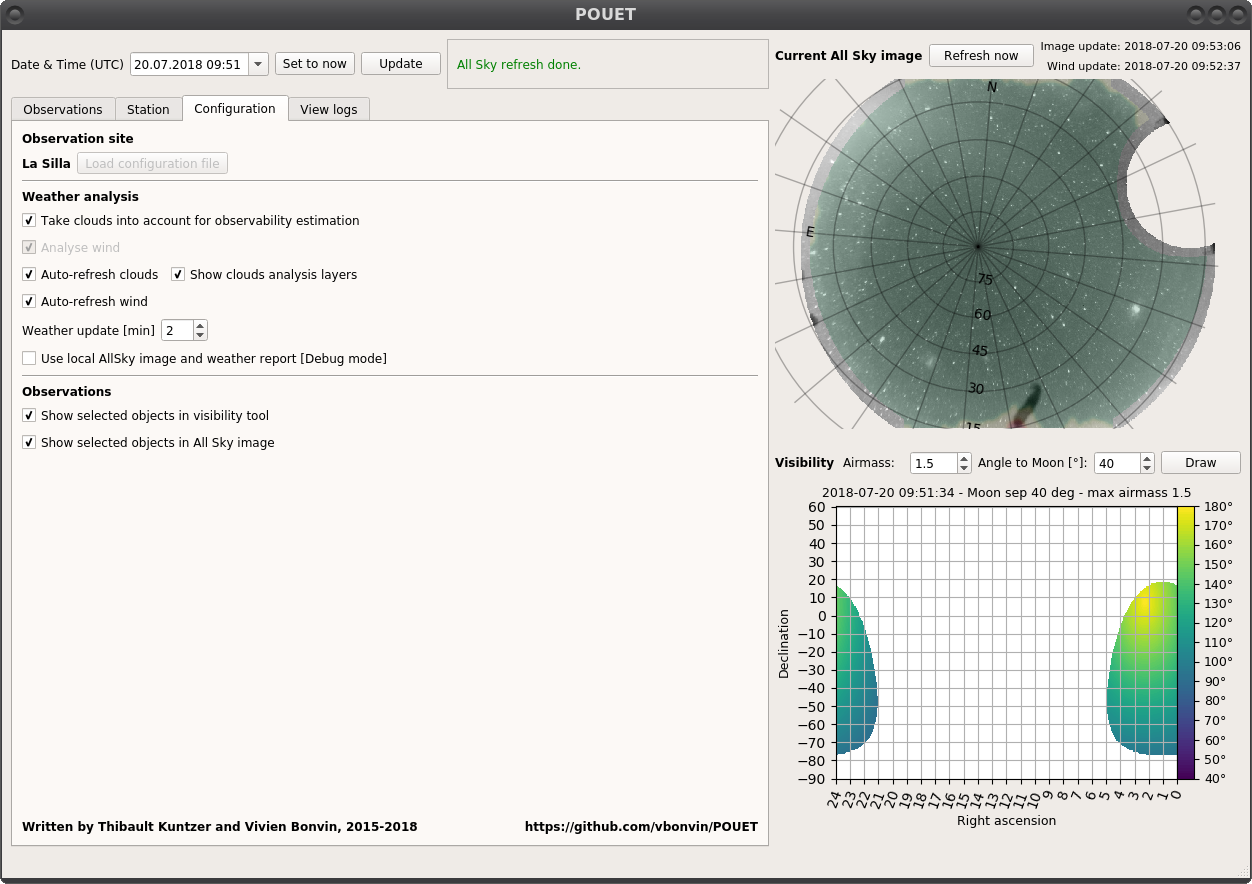
By checking/unchecking the checkboxes, you can control the behaviour of the weather analysis. You can also control the behaviour of the Display selected button in the Observations panel, if you want the selected targets to be displayed only in the all-sky or visibility view.
Note
an upcoming feature (planned for version 0.4) will allow you to create/load a new configuration file directly from the Configuration panel. Until then, the corresponding button will remains gray, a dull reminder of our failures as developer to deliver everything we promise on time.
View logs tab
Particularly useful is something goes nuts and you don’t know why, the View logs tab keeps track of the majority of what happens in POUET. In case you want to report a suspicious behaviour, copy/pasting the last five minutes of the logs along with your report might be super useful for us.
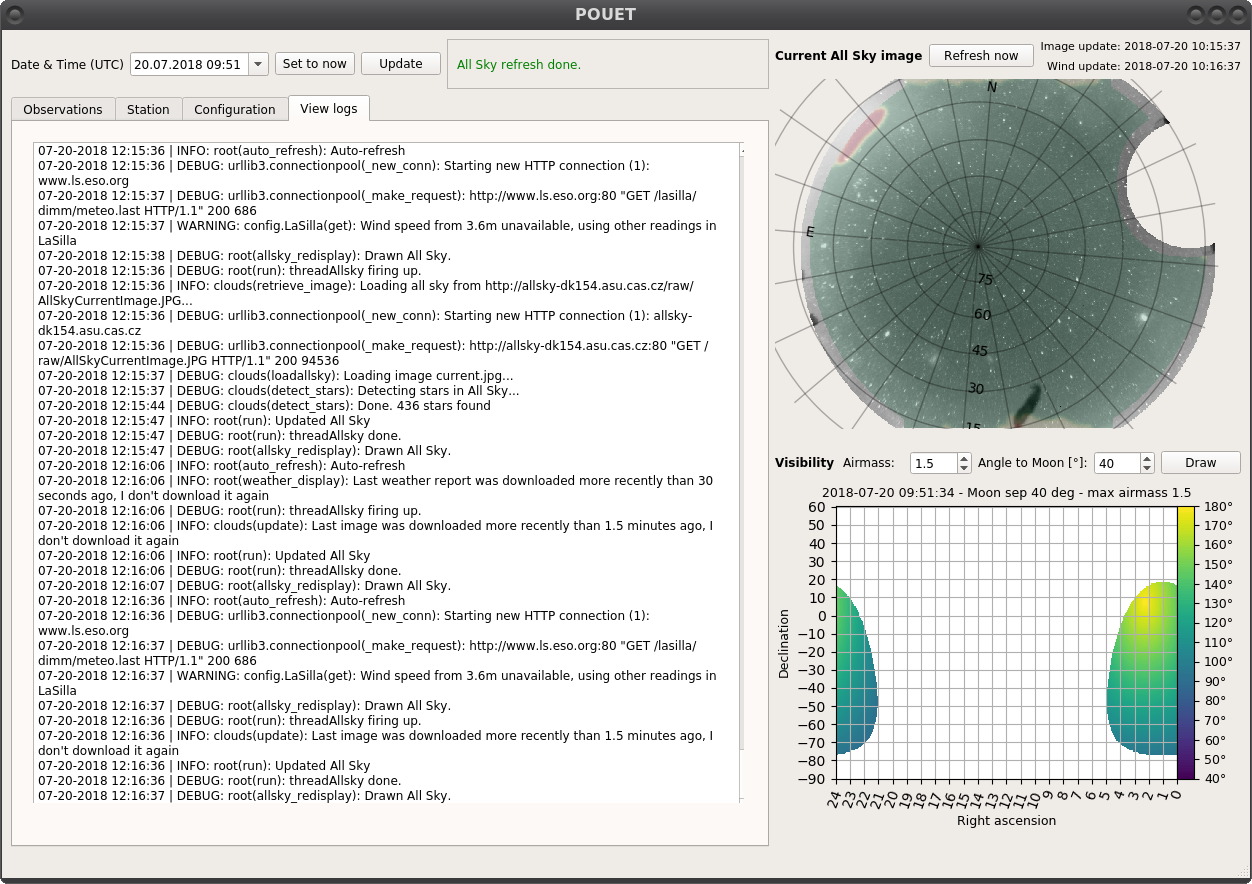
The View logs tab of POUET usually displays a massive wall of text.